
Poverty Falls, Inequality Persists: The Reality Behind India’s Development Figures
India has made significant progress in reducing poverty, with hundreds of millions moving above the poverty line over the past two decades. But does declining poverty necessarily mean a more equal society? Examining the World Bank’s latest poverty and equity findings, Vikas Parasram Meshram explores the widening gap between consumption, income and wealth, persistent regional disparities, insecure employment and the challenges that remain beyond India’s celebrated development figures.
When we discuss India’s development over the past two decades, one figure repeatedly comes up: the hundreds of millions of people who have moved out of poverty. This achievement is real, and its significance cannot be understated. Yet no single statistic can tell the whole story. A decline in poverty and a reduction in economic inequality are two different things. The proportion of a country’s population living below the poverty line can shrink even as the incomes and wealth of those at the top grow much faster. The World Bank’s October 2026 Poverty and Equity Report highlights precisely this contradiction and raises an important question: should we celebrate this progress, or should we also be concerned about what the figures leave out?
According to the World Bank’s October 2026 report, approximately 496 million Indians moved out of poverty between 2011 and 2023. The proportion of people living in extreme poverty fell from 27.1 per cent to 2.6 per cent, measured against the international poverty line of $3 a day (in 2021 purchasing power parity terms). At the $4.20-a-day poverty line for lower-middle-income countries, the proportion fell from 57.7 per cent in 2011 to 16.1 per cent in 2023. The report describes this as one of the fastest reductions in poverty in the world.
One technical point needs clarification. In June 2025, the World Bank revised its international poverty lines, raising the extreme poverty threshold from $2.15 to $3 a day. Consequently, the 2.3 per cent figure cited in the April 2025 report and the current figure of 2.6 per cent are not directly comparable, as they are based on different reference years, poverty lines and methodologies. Purchasing power parity (PPP) is a measure that accounts for differences in the cost of living across countries. Therefore, these poverty thresholds cannot be converted into rupees using market exchange rates.
The picture of multidimensional poverty is also encouraging. According to the Multidimensional Poverty Index developed by the Oxford Poverty and Human Development Initiative, the proportion of people living in multidimensional poverty fell from 53.8 per cent in 2005–06 to 16.4 per cent in 2019–21. By the World Bank’s own measurement, it stood at 15.5 per cent in 2022–23. This indicates improvements not only in income but also in access to essential facilities and services such as education, healthcare, electricity, sanitation and drinking water. Government schemes providing piped water, household electricity, cooking gas and subsidised food grains have contributed to these improvements.
In the World Bank’s assessment, the main drivers of this decline include rising consumption, increased employment, particularly among women, and social transfers such as food grain subsidies. Between 2017 and 2023, the number of employed people in India increased by approximately 134 million. Women’s participation in paid work in rural areas also rose, providing many families with an additional source of income.
Even so, the report itself sounds a note of caution. Since these estimates are based on consumption surveys, the World Bank acknowledges that some of the reported improvements may reflect changes in measurement methods as well as genuine improvements in people’s welfare. The number and format of questions changed between the 2011–12 and 2022–23 surveys. We must therefore exercise caution when interpreting and comparing these figures.
The most contested aspect of the report concerns inequality. The World Bank recorded India’s Gini index at 23.0 for 2023. The Gini index ranges from zero to 100, with zero representing perfect equality and 100 representing perfect inequality. A score of 23 places India among the most economically equal countries in the world according to this measure. At the government level, as well as in political responses to the report, this figure has been presented as an achievement.
But there is an important caveat. This index is based on consumption expenditure, not income or wealth. Wealthier households invest and save a substantial proportion of their earnings, meaning that their consumption expenditure may not reflect their actual economic power. Moreover, household surveys often fail to adequately capture the consumption patterns of the super-rich. The World Bank itself acknowledges that inadequate representation of wealthy households in surveys can make inequality appear lower than it actually is. Comparisons between India’s consumption-based Gini index and the income-based indices used by countries such as China and the United States are therefore misleading.
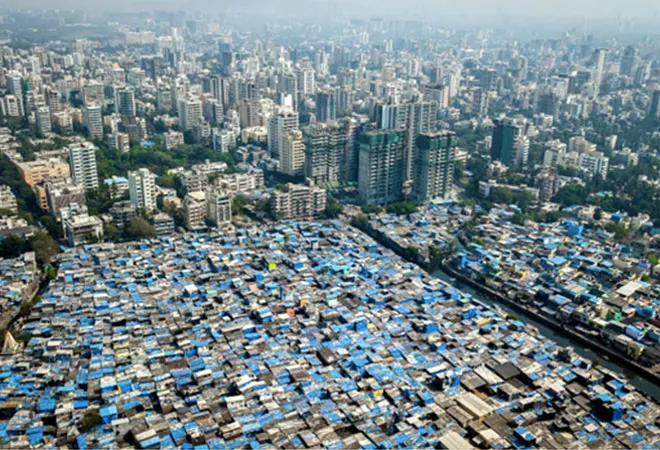
The picture that emerges from income and wealth data is quite different. According to an analysis based on tax return data, India’s income Gini index increased from 51 in 2004 to 61 in 2023. The World Inequality Report 2026 estimates that the richest 10 per cent of Indians own approximately 65 per cent of the country’s wealth, while the top 1 per cent alone hold about 40 per cent. The top 1 per cent also receive 22.6 per cent of national income, whereas the bottom 50 per cent receive just 14.6 per cent. The same report indicates that the income gap between the top 10 per cent and the bottom 50 per cent did not narrow between 2014 and 2024 but remained largely unchanged. In other words, although inequality may appear to be declining when measured through consumption expenditure, it persists and may even be widening when measured through income and wealth.
The World Bank report provides further evidence of this disparity. In 2023, the median income of workers in the top 10 per cent was approximately 13 times that of workers in the bottom 10 per cent. Put simply, for every thousand rupees earned by a worker in the bottom tenth, a worker in the top tenth earned approximately thirteen thousand rupees.
However, rising employment figures need to be examined more closely. According to the World Bank, much of the increase in employment occurred in agriculture and other low-productivity sectors. Since a significant share of the new employment was generated in these sectors, improvements in real wages have remained limited. In other words, more people may be working, but the actual purchasing power of their earnings has not increased substantially. Self-employment has become an important means of livelihood for many rural women, but it does not necessarily guarantee regular earnings, social security or a stable income.
Youth unemployment is another major concern. According to the report, the youth unemployment rate increased from 14.6 per cent in the first quarter of 2025–26 to 15.9 per cent in the first quarter of 2026–27, with young rural women particularly affected. In a country whose greatest strength is often said to be its young population, the failure to provide employment opportunities that match young people’s qualifications and skills could gradually turn the much-celebrated ‘demographic dividend’ into a ‘demographic burden’. When educated young people cannot find suitable employment, their frustration does not remain merely a personal problem; it can develop into a wider source of social unrest.
The gap between rural and urban poverty has narrowed, but it has not disappeared. At the $4.20-a-day poverty line in 2023, 19.3 per cent of the rural population lived in poverty, compared with 8.6 per cent of the urban population. This means that a person living in a rural area was more than twice as likely to be poor as someone living in an urban area.
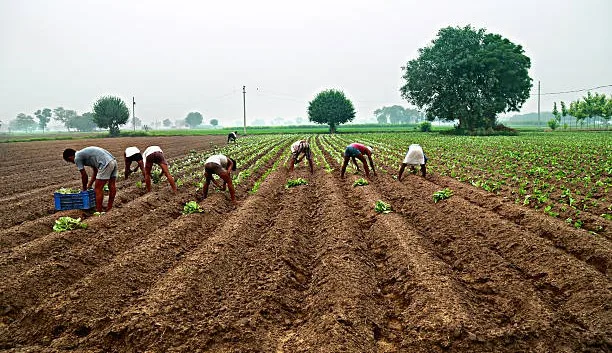
Regional inequality is equally serious. According to the April 2025 report, the five most populous states—Uttar Pradesh, Maharashtra, Bihar, West Bengal and Madhya Pradesh—accounted for approximately two-thirds of the decline in poverty. Yet, in 2022–23, 54 per cent of India’s extremely poor population still lived in these same states. In other words, the regions that recorded substantial progress in poverty reduction are also home to the largest concentrations of people who remain extremely poor. The benefits of development have not reached all regions at the same pace. For tribal communities, people living in remote hilly areas, migrant workers and landless agricultural labourers, national averages can often conceal the harsh realities of everyday life.
The poverty line itself is an artificial statistical threshold. A person living just above it can easily slip back into poverty because of an illness, a failed crop or the loss of a job. The World Bank report draws attention to this vulnerability. Approximately 80 per cent of India’s population in 2023 lived below the upper-middle-income poverty line of $8.30 a day. This indicates that the majority of Indians remain economically insecure. Even today, approximately 35 million people live in extreme poverty, while 232 million remain below the $4.20-a-day poverty line.
Inflation, illness, climate change, erratic rainfall and unemployment affect these vulnerable populations most severely. Although transfers such as free or subsidised food grains provide essential support to these families, dependence on such assistance alone cannot offer a long-term solution. Economists have warned that people who rely on these transfers may slip back into poverty if the support is withdrawn. The pace of poverty reduction is also expected to slow. The proportion of people living below the $4.20-a-day poverty line is projected to decline from 14.2 per cent in 2026 to 12.1 per cent by 2028. This suggests that the relatively easier stages of poverty reduction may already be behind us. The remaining challenge will be considerably harder because the poverty that persists is deeply entrenched.
What, then, needs to be done?
First, productive and secure employment must become a priority. Merely increasing the number of jobs will not be enough; the quality of employment, wages and job security must also improve. Promoting agro-processing industries, small and medium-sized enterprises, rural manufacturing and the services sector can generate better employment opportunities closer to people’s homes. Targeted policies are also necessary for economically disadvantaged regions such as Uttar Pradesh, Bihar, West Bengal and the Vidarbha–Chhattisgarh–Jharkhand belt.
Second, investment in education and skill development must increase. It is essential to bridge the gap between educational qualifications and labour market requirements, create greater opportunities for young women in rural areas, and establish better pathways from education to employment. Reducing out-of-pocket healthcare expenditure is equally important, as medical emergencies and illness remain major reasons why families fall back into poverty.
Third, the way inequality is measured must improve. Unless the government publishes reliable, regular and publicly accessible data on income and wealth, the true extent of inequality will remain obscured. Combining consumption surveys with tax records and other sources of information can provide a more realistic picture of economic disparities. What is not measured cannot be properly addressed.
Fourth, the tax and social security systems must become fairer. There needs to be an open public debate on taxation of the super-rich, as well as on inheritance and wealth policies. At the same time, pensions, insurance and healthcare protection must be strengthened for workers in the unorganised sector, landless labourers, migrant workers and tribal communities. Strengthening local communities’ rights over natural resources such as land, forests and water can also help secure their livelihoods.
Fifth, civil society organisations, local institutions and the media have an important role to play. From the gram panchayat to the district level, communities must actively monitor whether the benefits of government schemes actually reach those who need them. Organisations and journalists working on the ground can bring the lived experiences of marginalised people into public discussions, giving visibility to the human realities behind the statistics.
India’s success in reducing poverty is undoubtedly an achievement, and there is no reason to deny it. The lives of hundreds of millions of people have genuinely improved. But it would be misleading to use this success to suggest that all is well. The relative equality reflected in consumption figures is not evident in the distribution of income and wealth. Employment has increased, but wages have not kept pace. Youth unemployment remains a serious concern. Disparities between rural and urban areas, as well as between states, persist. Millions of families living just above the poverty line remain only one economic shock away from falling back into poverty.
The true measure of development lies in what has changed on people’s plates, in their schools and healthcare facilities, and in the employment opportunities available to those at the margins of society. While the figures may offer reasons to celebrate, looking beyond them to the realities on the ground is the real test of responsible policymaking and an informed citizenry.
Eradicating poverty is only the first stage of the journey. Achieving equality, dignity and economic security for all is the second and far more difficult stage that still lies ahead.
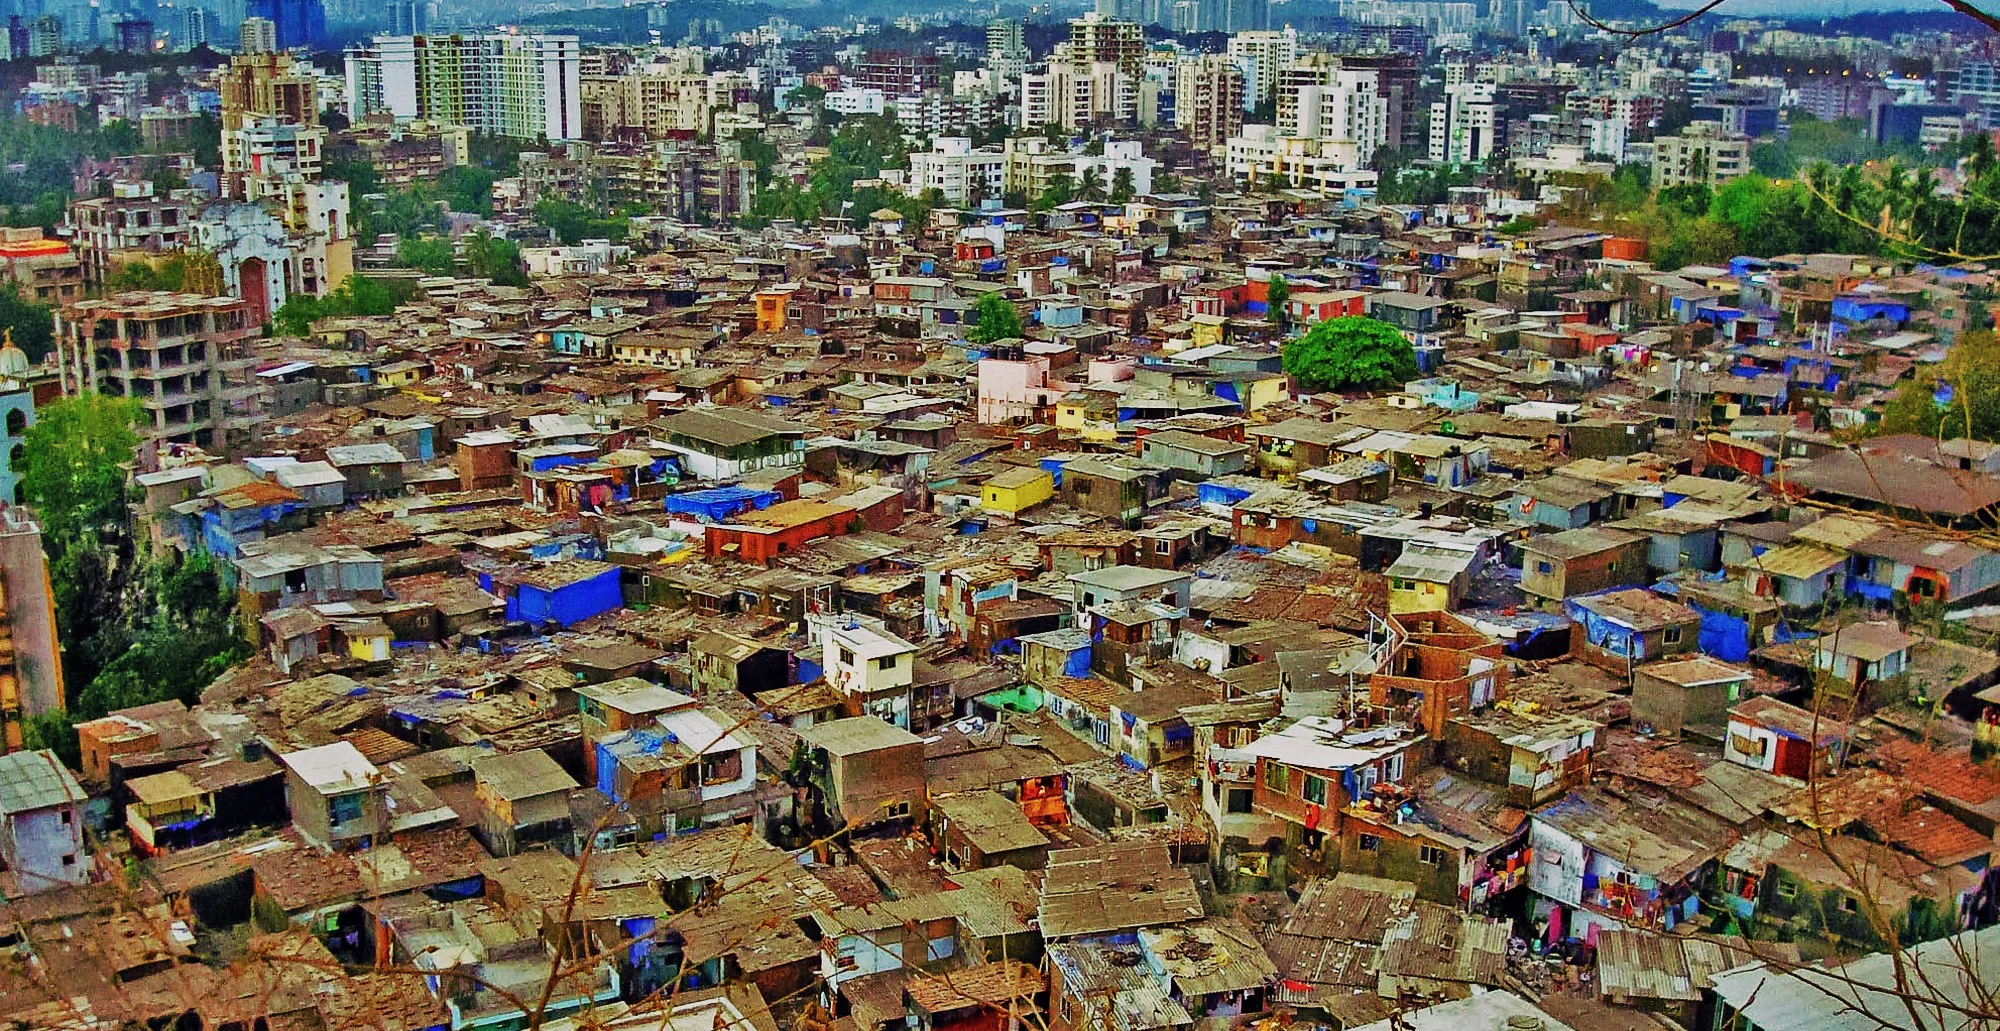
Featured Image: In space-starved Mumbai, which has some of the priciest real estate in the world, the shortage is even more critical, with hundreds of migrants from rural areas cramming into the city every day to seek better prospects. Image: Nishantd85,CC BY-SA 3.0, via Wikimedia Commons

Vikas Parashram Meshram is a development professional, writer, and grassroots storyteller with extensive experience in rural livelihoods, community development, and social-sector programmes. His work focuses on documenting grassroots innovations, sustainable livelihoods, women’s empowerment, agriculture, natural resource management, and rural development. Through his writing, he brings the experiences and voices of rural communities to a wider audience, highlighting practical solutions and stories of social and economic transformation.